Since its official launch on April 22, 1996, the Nifty 50 index has evolved into India’s most tracked benchmark, representing the performance of 50 large-cap companies across 13 sectors. With a base value of 1000 set on November 3, 1995, Nifty has delivered a compound annual growth rate (CAGR) of ~12.93% as of April 2025—a testament to India’s economic expansion and market maturity.
Parallel to this growth, India’s derivatives market has undergone a dramatic transformation. While commodity futures date back to 1875 via the Bombay Cotton Trade Association, modern exchange-traded equity derivatives began in June 2000, when SEBI permitted trading in Nifty and Sensex index futures. Today, derivatives trading accounts for over 99% of NSE’s turnover, with options becoming the preferred instrument for retail and institutional traders alike.
At the heart of intraday decision-making lies the candlestick chart—a Japanese invention from the 18th century that visually captures market sentiment through price action. Patterns like Hammer, Engulfing, and Doji offer traders a psychological map of buyer-seller dynamics, especially when paired with volume and open interest shifts.

Most intraday slots show recurring behavioral categories:
🔼 Bullish continuation
🔽 Bearish retracement
⏸️ Neutral consolidation


Insights You Can Trade On:-


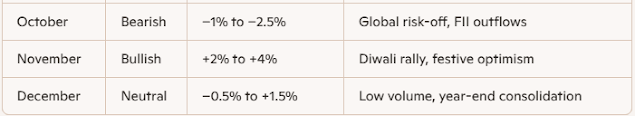
Monthly Nifty 50 Movement – Historical Bias (2000–2025):

Nifty 50 Weekly Performance Trends (Jan-Dec)
Key:
W1: Week 1 (1st Mon-Fri)
W2: Week 2 (2nd Mon-Fri)
W3: Week 3 (3rd Mon-Fri)
W4: Week 4 (4th Mon-Fri)
Price Range: Typical weekly movement (High-Low)


January Effect: Strong starts (W1: 68% bullish) due to institutional inflows and budget optimism.
May & September Weakness:
May W1 & W3: >65% bearish (tax-loss harvesting, global risk-off) 12.
Sep W1 & W2: >70% bearish (quarter-end rebalancing, FII outflows).
December Rally:
W2 & W3: 75–80% bullish ("Santa Rally" driven by retail participation) 9.
Neutral Dominance: 60–70% in February W1, June W3, August W1 (consolidation before earnings).
Understanding Key Technical Indicators in Nifty Derivatives Trading:-
Technical indicators are mathematical calculations based on historical price, volume, or open interest data. Traders use them to gain insights into market sentiment, potential future price movements, and volatility. Here, we elaborate on some core indicators crucial for Nifty derivatives trading.
Candlestick charts are a visual representation of price action over a specific time period. Each "candle" tells a story about the open, high, low, and close prices.
Elaboration: Candlesticks provide immediate visual cues about market sentiment (bullish or bearish) and momentum. They can form patterns over multiple periods, signaling potential reversals or continuations of trends.
Green/White Candlestick: The closing price was higher than the opening price, indicating bullish sentiment.
Red/Black Candlestick: The closing price was lower than the opening price, indicating bearish sentiment.
Body: The main rectangular part of the candle, showing the range between the open and close. A large body indicates strong buying or selling pressure.
Wicks (or Shadows): The thin lines extending above and below the body, showing the highest and lowest prices reached during the period. Long wicks can indicate volatility or rejection of a price level.
Candlestick Type / Pattern | Description | Implications |
Single Candles | ||
Doji | Small or non-existent body with long wicks. Open and close prices are very close. | Indecision in the market. Buyers and sellers are in balance. |
Hammer/Hanging Man | Small body (green/red) near the top of the range, with a long lower wick. | Hammer (bullish): Appears after a downtrend, suggesting potential reversal. |
Hanging Man (bearish): Appears after an uptrend, suggesting potential reversal. | ||
Engulfing Pattern | A large candle (bullish or bearish) completely engulfs the body of the previous candle. | Bullish Engulfing: Strong buying pressure. Potential reversal after downtrend. |
Bearish Engulfing: Strong selling pressure. Potential reversal after uptrend. | ||
Morning/Evening Star | Three-candle reversal pattern. | Morning Star (bullish): Downtrend reversal. |
Evening Star (bearish): Uptrend reversal. |
RSI is a momentum oscillator that measures the speed and change of price movements. It oscillates between 0 and 100.
Elaboration: RSI helps traders identify overbought or oversold conditions in Nifty.
RSI > 70: Generally considered overbought, suggesting Nifty might be due for a pullback or consolidation.
RSI < 30: Generally considered oversold, suggesting Nifty might be due for a rebound or consolidation.
RSI around 50: Indicates neutral momentum.
Divergence: A key signal where Nifty's price makes a new high/low, but RSI fails to confirm it, suggesting a weakening trend.

ATR is a measure of market volatility over a specific period. It indicates the average range between the high and low prices (and sometimes previous close) over that period.
Elaboration: ATR helps traders gauge how much Nifty is moving on average. It does not indicate direction, only the magnitude of movement.
Rising ATR: Indicates increasing volatility, meaning larger daily/hourly price swings.
Falling ATR: Indicates decreasing volatility, meaning smaller daily/hourly price swings.
Usage: Useful for setting stop-loss levels, profit targets, and understanding the potential range of movement for options pricing.

Candlesticks show price action and sentiment.
RSI indicates momentum and potential overbought/oversold levels.
ATR measures volatility, helping traders assess the expected magnitude of moves.

Theta is negative for long options (buyers lose value daily).
Theta is positive for short options (sellers gain from time decay).
At-the-money (ATM) options have the highest Theta.
Time decay accelerates in the last 30 days before expiry.
Suppose you buy a Nifty 50 25,600 CE expiring in 10 days, priced at ₹120 with a Theta of –5.
After 1 day, if Nifty doesn’t move, the option may drop to ₹115.
After 5 days, it could decay to ₹95–₹100 even if Nifty stays flat.
This is why option sellers (especially on expiry day) often benefit from Theta decay, while buyers must time their entries precisely.
Understanding ITM, OTM and ATM of Strike Prices:-
Definition: Strike price is closest to the current price of Nifty.
Example: Nifty at 25,600 → 25,600 strike CE and PE are ATM.
Features:
Highest Theta decay
Most sensitive to price movements
Popular in straddle/strangle setups
Definition:
CE: Strike price is below current Nifty
PE: Strike price is above current Nifty
Example:
Nifty at 25,600 → 25,500 CE and 25,700 PE are ITM
Features:
Higher intrinsic value
More expensive premium
Lower Theta decay, safer for buyers
Definition:
CE: Strike price is above current Nifty
PE: Strike price is below current Nifty
Example:
Nifty at 25,600 → 25,700 CE and 25,500 PE are OTM
Features:
No intrinsic value (all premium is time value)
Cheaper, more leveraged
High Theta decay, riskier for buyers
1) A Straddle involves buying or selling a Call and Put at the same strike price and expiry.
✅ Long Straddle
Buy ATM Call + ATM Put
Profits if Nifty moves significantly in either direction.
📘 Example
Buy Nifty 25,500 CE @ ₹110
Buy Nifty 25,500 PE @ ₹105
Total cost = ₹215
Breakeven = 25,715 (upside) or 25,285 (downside)
If Nifty closes at 25,800 → CE = ₹300, PE = ₹0 → Net = ₹85 profit.
2) A Strangle involves buying or selling Out-of-the-Money (OTM) Call and Put options.
✅ Long Strangle
Buy OTM Call + OTM Put
Lower cost than straddle, but needs bigger move
📘 Example
Buy Nifty 25,600 CE @ ₹70
Buy Nifty 25,400 PE @ ₹65
Total cost = ₹135
Breakeven = 25,735 or 25,265

Theta Decay (Time Decay): The Seller's Best Friend
Explanation: Options lose value as time passes and they approach their expiry date. This loss of value is called Theta decay.
Seller's Advantage: Option sellers (who sell calls or puts) benefit from this decay. Every day that passes, if the Nifty stays relatively flat or moves in a non-threatening direction, the premium of the options they sold erodes, and they profit from this erosion.
Buyer's Disadvantage: Option buyers (who buy calls or puts) suffer from Theta decay. Their purchased options are constantly losing value due to time passing, requiring a significant and quick move in the underlying asset (Nifty) to offset this decay and become profitable.
Probability of OTM (Out-of-the-Money) Expiry:
Explanation: A large percentage of options expire worthless (out-of-the-money). This is because for an option to be profitable for the buyer, the underlying asset (Nifty) must move significantly beyond the strike price by expiry.
Seller's Advantage: Sellers choose strikes that they believe are unlikely to be reached by expiry. By selling OTM options, they are betting on the option expiring worthless. The statistical probability of an OTM option expiring worthless is significantly higher than it expiring in-the-money.
Buyer's Disadvantage: Buyers need a substantial move, and the further OTM they buy (to save on premium), the lower their probability of success.
Implied Volatility (IV) Contraction:
Explanation: Options premiums are higher when implied volatility (the market's expectation of future price swings) is high. After an event (like election results, budget announcement, quarterly results) or a period of high uncertainty, implied volatility tends to decline (known as "IV crush").
Seller's Advantage: Sellers often try to sell options when implied volatility is high, benefiting when it later contracts. They collect a higher premium upfront, and even if the Nifty moves slightly against them, the drop in IV can offset some of that price movement, reducing their loss or even keeping them profitable.
Buyer's Disadvantage: Buyers pay a higher premium when IV is high, and if IV drops, their options lose value even if the Nifty stays flat or moves slightly in their favor.
Limited Upside for Buyers, Multiple Scenarios for Sellers:
Buyer: A call option buyer only profits if Nifty goes up significantly. A put option buyer only profits if Nifty goes down significantly.
Seller:
Call Seller: Profits if Nifty goes down, stays flat, or goes up slightly (as long as it stays below the sold strike).
Put Seller: Profits if Nifty goes up, stays flat, or goes down slightly (as long as it stays above the sold strike).
Straddles/Strangles (selling both call and put): Profit if Nifty stays within a range.
This gives sellers more "ways to win" compared to buyers, who need a strong directional move.
Capital Requirements and Risk Management:
Seller: Options selling involves higher margin requirements, as the theoretical loss is unlimited for naked options (though this can be managed with spreads). This often means sellers are better capitalized and potentially more sophisticated in their risk management.
Buyer: Requires less capital upfront, which attracts more retail traders, but this also means losses can occur quickly if the directional bet is wrong and theta eats away at the premium.

Why the Bullish Bias Doesn't Necessarily Help Buyers More:
While Nifty tends to go up over the long term, its movement is rarely a straight line. It experiences periods of consolidation, sideways movement, and even corrections.
Sideways/Consolidation: These are death zones for options buyers as Theta eats away premiums. Sellers thrive in these environments.
Small Moves: Small upward moves might not be enough for a buyer to overcome Theta and breakeven. A seller, however, can still profit from such a move if it's within their comfort zone or if the option was far OTM.
In essence, options sellers are paid for taking on the risk of significant price movement and for providing liquidity. They benefit from the passage of time, the tendency of options to expire worthless, and potential drops in volatility. Options buyers, on the other hand, are betting on a rapid and substantial price move in their favor, against the forces of time decay.
Hedgers:
Objective: To mitigate or reduce financial risk associated with price fluctuations in an underlying asset. They use derivatives to "lock in" a price or rate for a future transaction.
Behavior: Often risk-averse. They have an existing or anticipated exposure to an asset (e.g., a farmer who will sell crops in the future, an importer who needs to buy foreign currency, a company with variable interest rate loans). They take an offsetting position in the derivatives market.
Example: A farmer sells wheat futures contracts today to guarantee a price for their harvest, protecting against a potential drop in wheat prices before they sell their crop. An IT company expecting payment in USD might buy a USD/INR currency future to protect against the Rupee appreciating before they receive the payment.
Speculators:
Objective: To profit from anticipated future price movements of an underlying asset. They take on risk with the expectation of earning significant returns.
Behavior: Risk-takers. They have a view on the market's direction (bullish or bearish) and use derivatives to gain leveraged exposure to that view. They are not trying to offset an existing risk but rather to generate profits from market volatility.
Types of Speculators:
Day Traders: Execute multiple trades within a single trading day, aiming to profit from small intraday price movements. They close all positions before the market closes.
Swing Traders: Hold positions for a few days to several weeks, looking to capture larger price swings within a broader trend.
Position Traders: Hold positions for longer periods (weeks, months, or even years), betting on long-term trends in the underlying asset.
Trend Followers: Identify and follow established market trends, buying when prices are rising and selling when prices are falling.
Contrarians: Bet against the prevailing market sentiment, buying when others are selling (and vice-versa), believing the market has overreacted.
Arbitrageurs:
Objective: To exploit small price discrepancies (inefficiencies) between related assets or markets to make a risk-free profit.
Behavior: They simultaneously buy an asset in one market where it's undervalued and sell it in another market where it's overvalued. The profit comes from the price difference, and because the trades are simultaneous, the risk is minimal.
Example: If Nifty futures are trading at a slight premium or discount to the Nifty spot index, an arbitrageur might buy the cheaper one and sell the more expensive one, locking in a profit. This activity helps in price convergence across different segments of the market.
Market Makers:
Objective: To provide liquidity to the derivatives market by continuously quoting both bid (buy) and ask (sell) prices. They profit from the "bid-ask spread."
Behavior: They don't necessarily have a directional view on the market. Their goal is to facilitate trading and earn from the difference between the price at which they are willing to buy and the price at which they are willing to sell. They manage their inventory to minimize exposure to large price swings.
Role: Essential for efficient and liquid markets. Without market makers, it would be much harder for other participants (hedgers, speculators) to execute their trades quickly and at fair prices.
Margin Traders:
Objective: To use leverage to amplify potential returns.
Behavior: They put down only a fraction of the total value of the derivatives contract (the "margin") to control a much larger position. This can magnify both profits and losses. While margin trading is inherent in futures and options, "margin traders" specifically refers to those whose primary motive is to maximize their exposure with limited capital.
Risk: High risk due to leverage. Small adverse price movements can lead to significant losses and margin calls.
These categories are not mutually exclusive; a single market participant might engage in different types of derivative trading activities at various times or for different parts of their portfolio. For instance, a large institution might hedge some of its portfolio while speculating on specific opportunities.
I , Suripeddi Koundinya, a NISM-certified Mutual Fund Distributor since 2017 and a Financial Advisor since 2013. However, I am not a SEBI-registered Research Analyst and this article is intended for educational and informational purposes only.
The insights presented above are based on historical intraday data, candlestick behavior, and hora-wise price action patterns observed in Nifty 50. While past trends can serve as a probabilistic foundation for future trades, they do not guarantee outcomes in real-time markets.
Derivatives trading involves significant risk due to leverage, volatility, and rapid theta decay. Market conditions may change due to macroeconomic events, global cues, or sudden sentiment shifts—even during astrologically favorable horas.
That said, history often echoes through patterns, and traders who align timing, probability, and discipline stand a better chance of navigating this ever-evolving landscape.
No comments:
Post a Comment